Dow Jones Index, S&P500, and NASDAQ100 Detailed Technical Forecast

Table of Content
Key points
- Dow Jones index outperforms but has a bearish pattern formation
- S&P500 flirting around new record with the bearish formation on the card
- NASDAQ100 technical outlook
Technical outlook / Down Jones index
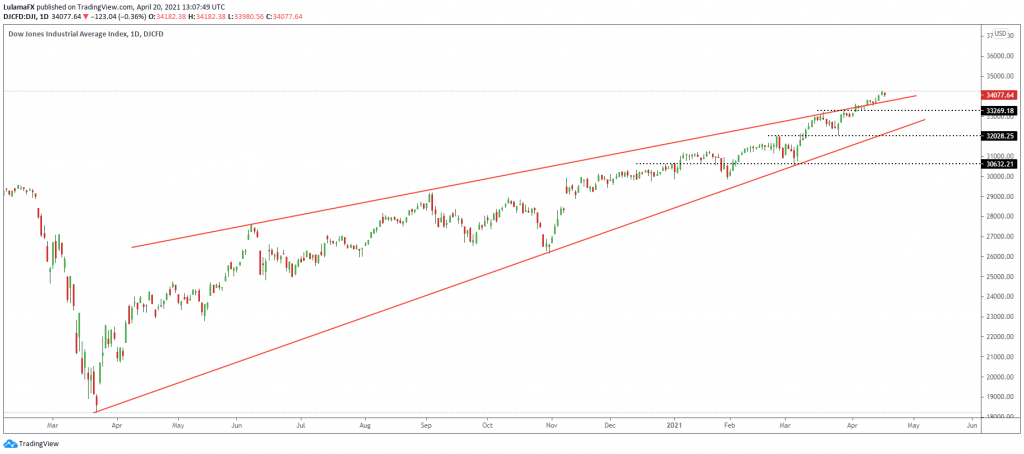
The Dow Jones index has been leading gains in the U.S markets as it outperforms the new school growth as it has been hitting new highs throughout the past three weeks. Technically, the Dow Jones index appears overbought as the market flirt in the record high, failing to find direction. The market movement has formed what appears to be a wedge formation in the market where a lower trendline acts as the lowest level of support, and the upper trend can be regarded as a resistance level.

The wedge formation appears to have broken out, and a retest has been formed in the pair. Yesterday, the Dow Jones index fell to 32,044 level, but the pair has stayed above the trend. Sellers will be eyeing a move below the trend for a further selloff and could be targeting the 33,269 levels.
Technical outlook / S&P500 index
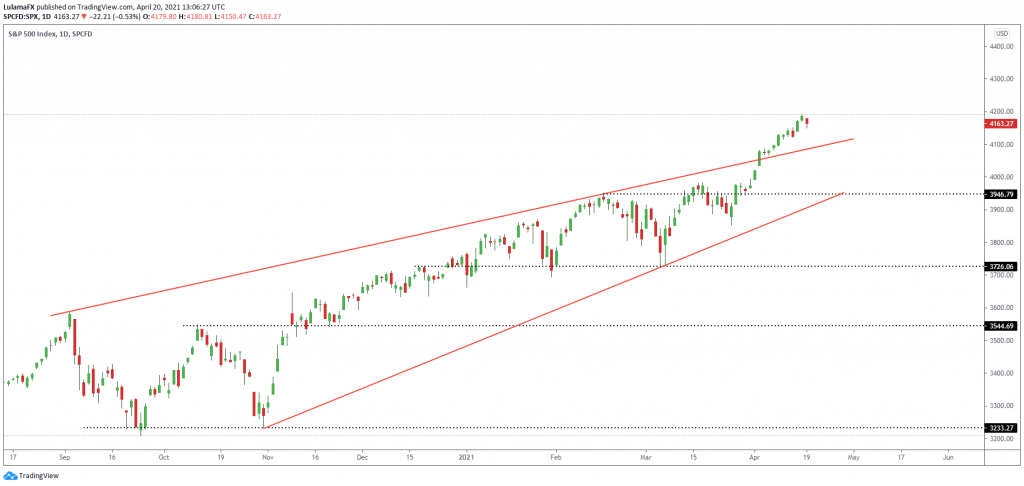
The S&P500 index rallied to new highs in recent market sessions as it follows the Dow move to record level. Technically, the index appears to have exhausted its bullish momentum after falling to 4150 yesterday as bullish pressure takes a knock from inflationary pressures ahead of corporate earnings. The trend has been broken, and the market could be looking for more selling pressure before buyers activate their pressure, and should the index continue sell-off, it might have to rest the trend before making an upside. On the other side, a move below the trend could see the market making a further drop-off to the support level at 3950.

On the other side, buyers will be looking for a retest on the trend, and a solid test could see buyers looking for more buying pressure targeting the price of 14,300.
Technical outlook / Nasdaq index
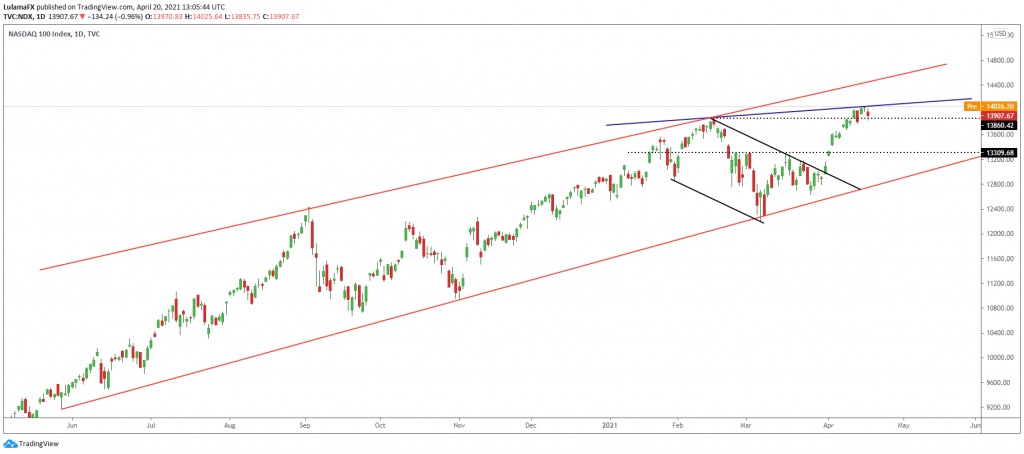
The Nasdaq100 made a surprising move to the downside on Monday’s trading session as the 14,000 level continues to be a bit of a problem for the bullish traders. At this point, the market appears ready to make another surprising pull-back below 14,000. The index was the worst performer yesterday, with the stocks also making a big sell-off ahead of the corporate earnings. The bullish traders should continue to monitor the dip areas and will be focusing on the Fed to keep the interest rate stable as this could be good for the growth stocks.

Technically, the stock index has rejected the February 2021 trend, which is a key level for the buyers and should the market continue to trade lower. This could see the market test the neck of the inverted head and shoulders at 13,300.
On the other hand, if the market breaks the February trend, we could see the index fuel up its bullish momentum to target 14,5000 levels before making a further strong move to 15,000 for the long term.
The top 3 indexes are expecting to countinue to perfrom well.
P.S
If you want to understand why Technical analysis is important, read here
Disclaimer: This material is a marketing communication and shall not in any case be construed as an investment advice, investment recommendation or presentation of an investment strategy. The marketing communication is prepared without taking into consideration the individual investors personal circumstances, investment experience or current financial situation. Any information contained therein in regardsto past performance or future forecasts does not constitute a reliable indicator of future performance, as circumstances may change over time. Scope Markets shall not accept any responsibility for any losses of investors due to the use and the content of the abovementioned information. Please note that forex trading and trading in other leveraged products involves a significant level of risk and is not suitable for all investors.


